PMT Webinar https://www.youtube.com/watch?v=xYLLq05-bSA
PMT Webinar https://www.youtube.com/watch?v=xYLLq05-bSA
We do realize, given our high performance, our trading systems are slightly under-priced, partially by design. We have resisted changing them till a certain level of product maturity was achieved. We have now traded the system over 8 months LIVE in the chat and only between late Feb to mid-March (Ukraine War) was difficult – we can always file a complaint with Comrade Putin but we do not expect a response LOL. Instead, we have included a volatility patch to mitigate such issues in the future.
Please be aware that HA Prop DayTrading Systems pricing for all three offerings (Basic, Elite and Elite MNQ) will be adjusted upward some time next week
https://www.hamzeianalytics.com/HAPDTS_Elite_MNQ_details.asp
<<<<< is $357 per month till May 13 -- then will be $456 on Sat May 14
https://www.hamzeianalytics.com/HAPDTS_details.asp
<<<< is $555 per month till May 13 --- then it will be $707 per month
https://www.hamzeianalytics.com/HAPDTS_Elite_details.asp
<<<< is $777 per month till May 13 --- then it will be $999
ELITE Packages will run on the Client's TradeStation. So yes, you need be proficient in TS.
This only impacts *new* or *returning* members
Existing Subscribers do nothing as we never raise pricing on active Members in a given product category.
If you are in a free test drive and like to join, this coming week is best time to lock-in current prices.
Have a great weekend.

The YTM for 10-Year Treasury Note breaks out again
Real Estate prices will continue to adjust down
Term Structure of the US Treasury Interest Rates


This chart shows the Term Structure of [risk free, if held till maturity] of interest rates (US Treasuries).
NOTE: how fast 5 & 10-yr Yield-to-Maturities (YTMs) have exploded in March.
5-yr is a benchmark for cars, while 10-yr is for housing.
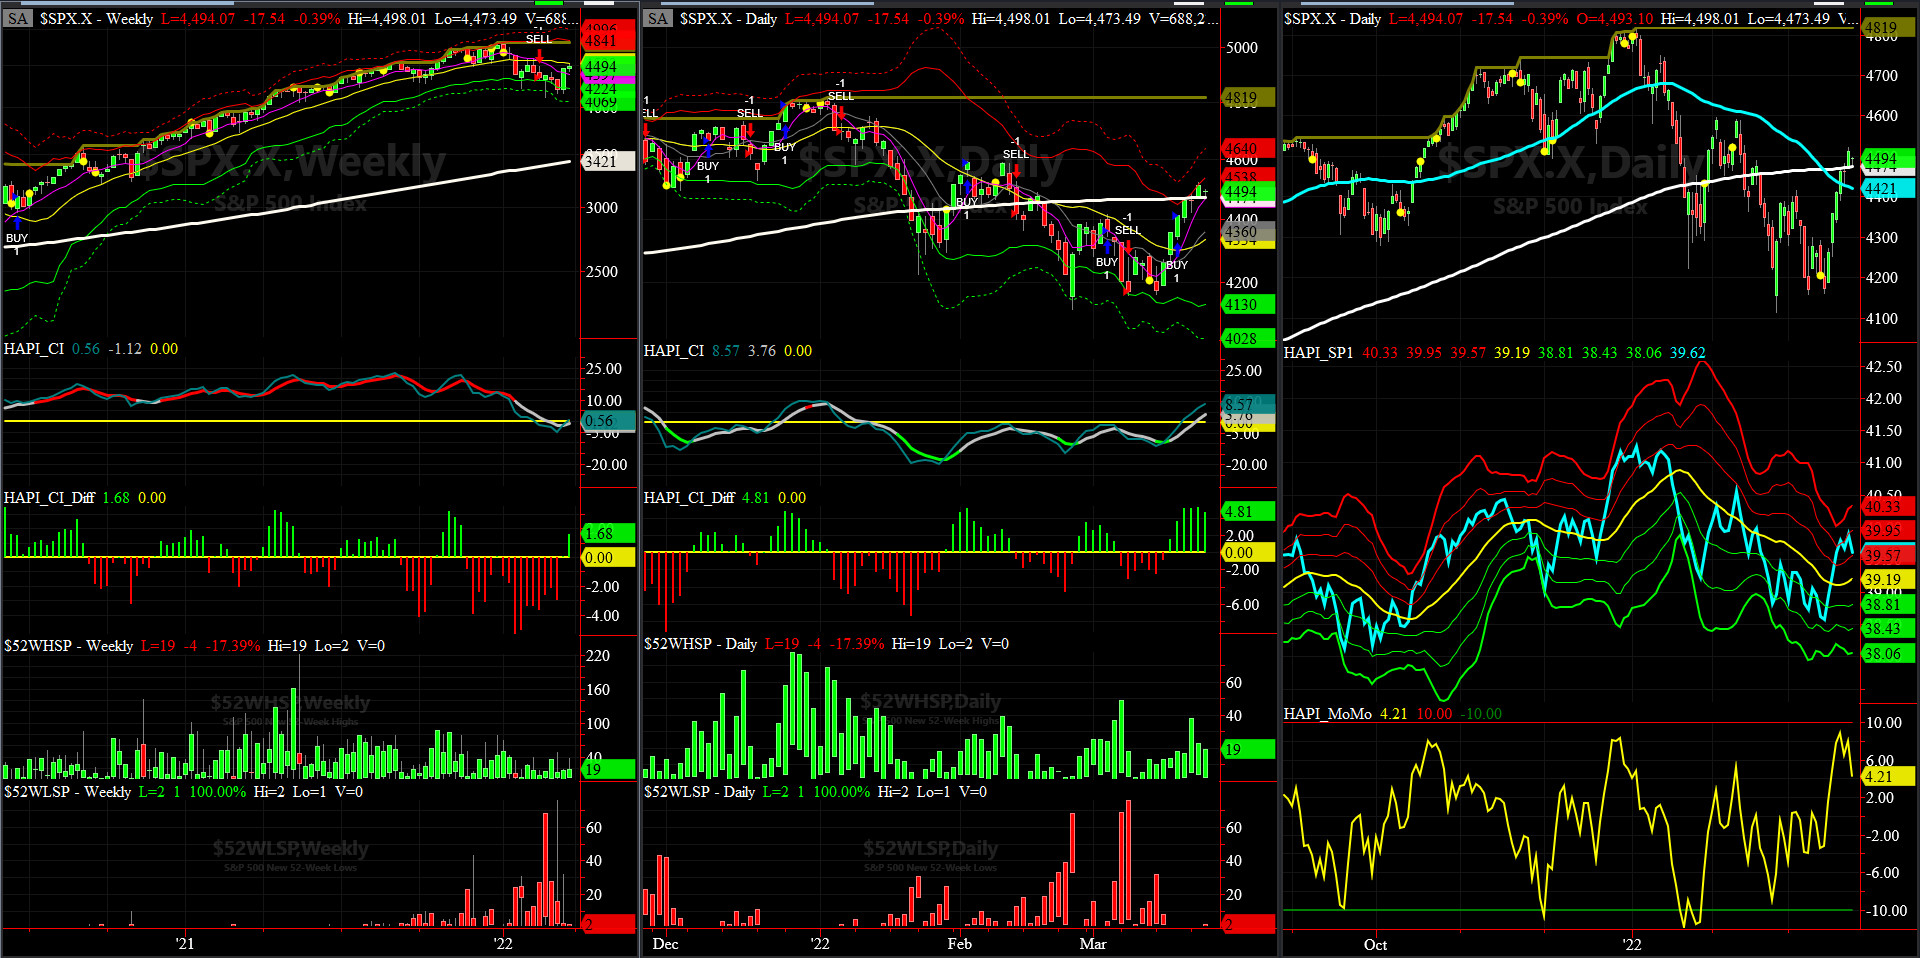
HAPI SP1_momo Chart

Note: everyone should study this PDF by Paul Desmond, former head of Lowry Research Corp
markets are wild these days
to better keep you informed of how we see the overall markets, we have created two permanent links (which you can join each just once) to our weekly proactive market timing webinars + our monthly OPEN HOUSE for HA ORB v4.x flagship product
it has reminders of each meeting
ues www.hamzeianalytics.com/login.asp to get to the free subcribe links
