Showing posts with label Brad Sullivan. Show all posts

Thursday, May 24, 2012

Brad Sullivan Trade Coverage: Profiting from Facebook IPO with Apple Stock Trade [Live Transcript]

Brad Sullivan Trade Coverage: Profiting from Facebook IPO with Apple Stock Trade [Live Transcript]SocialTwist Tell-a-Friend
Reposted from MarketHeist


**Written Tuesday, May 22, 2012.  
By Jeffrey Lin

 Last week, everyone, their brother, and even the grandma were zoned in on the main event: The Facebook IPO.

Many many times oversubscribed, the Facebook IPO has been the buzz for months for professional and individual investors alike.

On Friday morning Facebook started to trade on NASDAQ under the symbol FB. The stock opened trading at $42.05, bid up by the pent up demand from its $38 initial offer price, and has now hit a low of $31.12 at today’s close.

 So how do you make money from the Facebook IPO? Sometimes you have to look a degree or two away from the main event for opportunities.

 On Thursday afternoon, super trader Brad Sullivan demonstrated this type of experience in the Hamzei Analytics Premium HFT chatroom. Sullivan took advantage of the Facebook IPO frenzy by buying Apple (AAPL) at the market close at $530.30.

 While Facebook’s stock continues to nosedive below it’s IPO price, Apple didn’t trade much below Sullivan’s buy price of $530.30 and hit $573.88 this morning (Tuesday, 5/22/12). Great trades like this are posted consistently in this chatroom, led by Brad Sullivan and Fari Hamzei. Any one trade would pay for several years of subscribing to such truly professional services.

What was Brad Sullivan’s strategy and reasoning to buy Apple as the Facebook IPO trade?

With permission from Hamzei Analytics, here’s the real-time transcript from Hamzei Analytics’ Premium HFT chatroom. Here, Brad Sullivan explained, executed, and managed his risk in this trade (*note: member names hidden for confidentiality):   THURSDAY
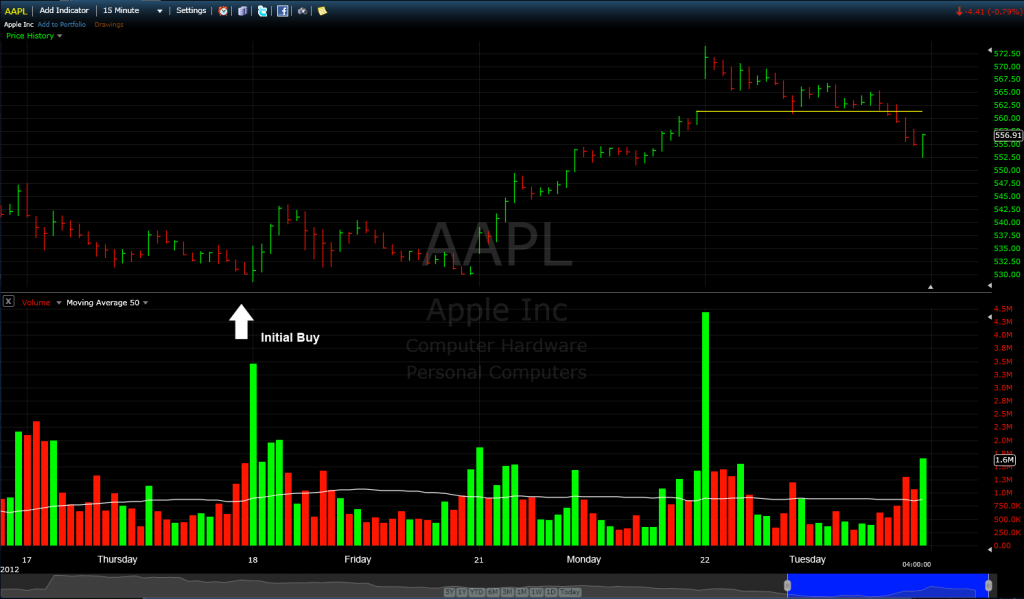
Brad_Sullivan [14:36:24 CT] : i will also be a buyer of AAPL on the cash close
Member A [14:37:37 CT] : would u buy APPL calls here
Brad_Sullivan [14:38:46 CT] : sure - I will give u my thesis
Brad_Sullivan [14:39:01 CT] : which is that FB has forced the selling in AAPL
Brad_Sullivan [14:39:06 CT] : to some extent
Brad_Sullivan [14:39:12 CT] : accordingly I want to be a buyer
Brad_Sullivan [14:39:18 CT] : on the other side of that skid
Brad_Sullivan [14:39:28 CT] : btw
Brad_Sullivan [14:39:31 CT] : the NQ
Brad_Sullivan [14:39:43 CT] : and AAPL - could get crazy at the close
Member A [14:44:09 CT] : crazy dumping or crazy buying
Brad_Sullivan [14:51:13 CT] : dynamic long hedging in the indices
Brad_Sullivan [14:51:23 CT] : has been the game
Brad_Sullivan [14:51:39 CT] : along w reduction in portfolio leverage
Brad_Sullivan [14:51:44 CT] : or outright sales
Brad_Sullivan [14:51:50 CT] : worth noting
Brad_Sullivan [14:51:57 CT] : the opening 60 minutes of volume in NQ
Brad_Sullivan [14:52:10 CT] : will run about 50% higher than the closing
Brad_Sullivan [14:52:13 CT] : pretty rare Brad_Sullivan [15:02:32 CT] : filled in AAPL around 530.30


FRIDAY
Brad_Sullivan [09:11:37 CT] : btw the AAPL purchase on the close
Brad_Sullivan [09:11:43 CT] : yday is rolling pretty good now
Brad_Sullivan [09:11:49 CT] : as for the indices
Brad_Sullivan [09:11:58 CT] : it is very very illiquid
Brad_Sullivan [09:12:04 CT] : caution
Brad_Sullivan [09:12:07 CT] : flags r out …
Brad_Sullivan [09:47:06 CT] : AAPL
Brad_Sullivan [09:47:23 CT] : I am offering 50% around the 548 level

MONDAY
Brad_Sullivan [09:49:09 CT] : AAPL working quite well today
Brad_Sullivan [09:54:47 CT] : I am offering 50% of the long AAPL 
Brad_Sullivan [09:54:55 CT] : position a touch above current levels 
Brad_Sullivan [09:55:08 CT] : between 548.50 and 552
Brad_Sullivan [12:57:10 CT] : As I had noted earlier, with my offers in AAPL
Brad_Sullivan [12:57:23 CT] : I was filled on the 50% reduction in position
Brad_Sullivan [12:57:29 CT] : taken on Thursdays close …
Fari_Hamzei [15:01:41 CT] : Brad's trade in $AAPL is getting great feedback from HFT Premium Members

TUESDAY
Brad_Sullivan [08:55:14 CT] : in AAPL I am selling another 10% of the position in the next hour
Brad_Sullivan [11:10:08 CT] : I am now liquidating another 10% of my AAPL position Brad_Sullivan [11:10:19 CT] : leaving me w a net long 30% position

Monday, February 6, 2012

Brad Sullivan Exclusive: Long Term Equity Market Trading and Outlook

Brad Sullivan Exclusive: Long Term Equity Market Trading and OutlookSocialTwist Tell-a-Friend
Video clip from a rare exclusive webinar with professional trader Brad Sullivan. Brad Sullivan talks about his short term, medium term, and long term market outlooks as well as his strategies for long term trading.


DATE: Recorded November 14, 2011. After Market Close

DOWNLOAD FULL VIDEO: http://www.hamzeianalytics.com/Educational_Webinars.asp

ABOUT BRAD SULLIVAN
Brad Sullivan is a featured trader in Hamzei Analytics HFT Chatroom: http://www.hamzeianalytics.com/HFT_details.asp

Brad Sullivan, an independent trader, who from 2002 to 2007 averaged about 10,000 contracts per day (trading ES, NQ and US Futures). Since mid-2007 to early 2011, he traded for a major proprietary trading firm in Chicago. For five years, from 2002 to 2007, his exclusive pre-open Equity Index Update was a must read for any serious stock index futures trader on our site, Minyanville and Traders-Talk, among others.

Thursday, February 2, 2012

Brad Sullivan Exclusive: Long Term Equity Market Trading and Outlook

Brad Sullivan Exclusive: Long Term Equity Market Trading and OutlookSocialTwist Tell-a-Friend
Video clip from a rare exclusive webinar with professional trader Brad Sullivan. Brad Sullivan talks about his short term, medium term, and long term market outlooks as well as his strategies for long term trading.


DATE: Recorded November 14, 2011. After Market Close

DOWNLOAD FULL VIDEO: http://www.hamzeianalytics.com/Educational_Webinars.asp

ABOUT BRAD SULLIVAN
Brad Sullivan is a featured trader in Hamzei Analytics HFT Chatroom: http://www.hamzeianalytics.com/HFT_details.asp

Brad Sullivan, an independent trader, who from 2002 to 2007 averaged about 10,000 contracts per day (trading ES, NQ and US Futures). Since mid-2007 to early 2011, he traded for a major proprietary trading firm in Chicago. For five years, from 2002 to 2007, his exclusive pre-open Equity Index Update was a must read for any serious stock index futures trader on our site, Minyanville and Traders-Talk, among others.

Wednesday, February 1, 2012

Brad Sullivan Exclusive: Futures Daytrade Strategy

Brad Sullivan Exclusive: Futures Daytrade StrategySocialTwist Tell-a-Friend
Video clip from a rare exclusive webinar with professional trader Brad Sullivan. Brad Sullivan reveals his futures daytrading strategy when answering a question about common trading strategies and techniques.

DATE: Recorded November 14, 2011. After Market Close

DOWNLOAD FULL VIDEO: http://www.hamzeianalytics.com/Educational_Webinars.asp

ABOUT BRAD SULLIVAN
Brad Sullivan is a featured trader in Hamzei Analytics HFT Chatroom: http://www.hamzeianalytics.com/HFT_details.asp

Brad Sullivan, an independent trader, who from 2002 to 2007 averaged about 10,000 contracts per day (trading ES, NQ and US Futures). Since mid-2007 to early 2011, he traded for a major proprietary trading firm in Chicago. For five years, from 2002 to 2007, his exclusive pre-open Equity Index Update was a must read for any serious stock index futures trader on our site, Minyanville and Traders-Talk, among others.

Tuesday, January 31, 2012

Brad Sullivan Exclusive: Monitoring the Markets - Key Indicators and Sectors to Watch

Brad Sullivan Exclusive: Monitoring the Markets - Key Indicators and Sectors to WatchSocialTwist Tell-a-Friend
Video clip from a rare exclusive webinar with professional trader Brad Sullivan. Brad Sullivan shows the various stock market indicators and sectors he uses to monitor the financial markets.

DATE: Recorded November 14, 2011. After Market Close

DOWNLOAD FULL VIDEO: http://www.hamzeianalytics.com/Educational_Webinars.asp

ABOUT BRAD SULLIVAN
Brad Sullivan is a featured trader in Hamzei Analytics HFT Chatroom: http://www.hamzeianalytics.com/HFT_details.asp

Brad Sullivan, an independent trader, who from 2002 to 2007 averaged about 10,000 contracts per day (trading ES, NQ and US Futures). Since mid-2007 to early 2011, he traded for a major proprietary trading firm in Chicago. For five years, from 2002 to 2007, his exclusive pre-open Equity Index Update was a must read for any serious stock index futures trader on our site, Minyanville and Traders-Talk, among others.

Wednesday, August 26, 2009

HFT Introductory Pricing is Over

HFT Introductory Pricing is OverSocialTwist Tell-a-Friend
Fari Hamzei

With Brad Sullivan joining us, as promised, our HFT introductory pricing period is over.

Tuesday, August 25, 2009

Brad Sullivan is back in our HFT Chatroom

Brad Sullivan is back in our HFT ChatroomSocialTwist Tell-a-Friend
Fari Hamzei

The venerable Chicago Super Trader, Brad Sullivan, will be rejoining our HFT Chatroom tomorrow. Here is bio, circa 2007.

He now runs money for a major algo shop two blocks from me here in Chicago: http://hamzeianalytics.com/docs/brad_sullivan.pdf


Here is how you can still join us at the introductory price: http://www.hamzeianalytics.com/hft_details.asp

Sunday, March 9, 2008

A Few 30 Minutes Charts Worth Noting

A Few 30 Minutes Charts Worth NotingSocialTwist Tell-a-Friend
Brad Sullivan

These charts were posted on Thursday March 6, 2008 at 1215 CST in our SuperPlatinum Virtual Trading Room.


Equity Index Update

Equity Index UpdateSocialTwist Tell-a-Friend
Brad Sullivan

This article and accompanying charts were posted on Thursday March 6, 2008 at 0830 CST in our SuperPlatinum Virtual Trading Room.

The index markets appear to be set for another volatile session as news out of MER, FNM and TMA have knocked the markets substantially from overnight highs. On the positive side of the ledger, WMT boosted their dividend and announced slightly better than anticipated monthly sales figures. Currently, the SPH is trading at 1328.50, -7.00 on the session and in the heart of yesterday’s final hour choppy trading zone. Considering that the Employment reading will be tomorrow morning, one has to wonder if the market will have enough “juice” to move substantially in either direction. However, if the news cycle continues to deteriorate and the dollar freefalls, anything can happen.

I have included several charts today…among them is a chart with daily closes in the SP Cash. It is worth noting that we are, for all intents and purposes, locked in a range between the January closing low of 1310.50 and the Feb High of 1392. However, the substantial portion of the settlements in the index has occurred between 1360 and 1335. The situation now is this…is we building a base from which to move higher or a topping base from which to move lower?


Thursday, February 21, 2008

Equity Index Update (Special Edition)

Equity Index Update (Special Edition)SocialTwist Tell-a-Friend
Brad Sullivan

Editor's Note: Brad Sullivan's Morning Commentary is usually posted in our SuperPlatinum Virtual Trading Room around 0845 CST.


The index markets are called to open higher as the market attempts to follow through on yesterday’s strong reversal. The SPH is trading at 1366, + 7.00 on the session. The real strength this morning lies in the NQH futures which are trading higher by +1% at 1807. Strength in the technology sector is being led by RIMM (Research In Motion) which updated guidance this morning and is trading higher by +12pts to 109.50. In addition, CSCO (Cisco) was upgraded in a research note and is higher by +2% in the premarket.

Today’s session should hinge on whether or not buyers step up at higher levels. Yesterday’s action was quite constructive for the buyside as sellers could not generate any selling below key support zones. Will the buyers step up today? Certainly the table is set.

I have enclosed 3 charts showing that show some interesting situations in the near term.


Wednesday, February 20, 2008

Equity Index Update (Special Edition)

Equity Index Update (Special Edition)SocialTwist Tell-a-Friend
Brad Sullivan

Editor's Note: Brad Sullivan's Morning Commentary is usually posted in our SuperPlatinum Virtual Trading Room around 0845 CST.

The index markets are called to open sharply lower on the heels of aggressive selling in the far east (Nikkei and Hang Seng lower by 2 and 3% respectively) and economic data that shows some signs of inflation here at home. The SPH is trading at 1336.50, lower by -19.00 on the session. Some of this headline decline is due to the premium settlement in the futures trade yesterday. After the cash close, HPQ reported better than anticipated earnings and the SPH rallied to settle +5.50 above fair value.

Today’s session should be dominated by the key support zone built up in the SPH from 1340 to 1330. If the index were to break below this zone on a 30 minute close it is a negative that should produce a test of the 1315 zone (chart enclosed). If the market holds this zone, there is potential for short covering towards the 1350 level; however given the makeup of our current environment (4 % range) a bounce like that should be sold.

External factors in today’s session will be the commodity market, specifically the energy complex. Yesterday, front month Crude Oil traded over $100 per barrel and seemed to trigger selling in the equity indices. Clearly any sustained trade above par is not helpful to the equity market and could be the trigger for a larger move. Conversely if Crude were to come off towards 98 it may be supportive in the shortest of time frames for equity traders.

I have enclosed 3 charts today…the first being a all session SP futures chart since Feb 1st on a 30 m inute basis. The second being a daily NDX 100 chart from the 2006 bottom and last a comparison chart of GS and the SPX.


Wednesday, January 9, 2008

Equity Index Update

Equity Index UpdateSocialTwist Tell-a-Friend
Brad Sullivan

The index markets suffered through a massive liquidation in the final 90 minutes of trading. At 1:30cst yesterday the SPH contract was trading at a recent high of 1432.50, that bid was quickly erased as heavy selling hit the market below 1425 and 1415…eventually leading to the ultimate puke that pushed the contract as low as 1393 after the cash close. Clearly the market is in a state of turmoil and during these times prices get out of line due to “need” based selling. The question, of course, is whether or not we are at that juncture…lets take a look at the past down moves in 2007:


As one can discern, the market has been awfully difficult for those that are purely long over this period. However, given the extremes in price movement one should be prepared for buying opportunities, even in the shortest of durations (from a time frame perspective). We have entered a spot that markets do not see that often and one thing that I have learned throughout these moves is that the market tends to go further than one thinks possible. In other words, yesterday may not have been the washout.

From the intraday perspective…the obvious target for the SP is the cash closing low from the spring of ’06 (1377.95). That level is certainly not to be construed as a line in the sand. Rather, just a benchmark about where the current market is trading. Keep a close eye on bounces, particularly in the morning that lose steam in the afternoon. Resistance lies between 1407.50 and 1414 in the SPH. Any settlement above 1423 is a positive and should lead to a position long.

Monday, December 17, 2007

Equity Index Update (Special Edition)

Equity Index Update (Special Edition)SocialTwist Tell-a-Friend
Brad Sullivan

Monday December 17, 2007

The index markets were weighed down on Friday with the release of a stronger than anticipated CPI reading. Volume flows were on the lighter side as interest in the trade was pretty muted…however, the SPZ did end the session lower by -1.5% and settled at session lows of 1478.50. This morning, the index is called to open lower at 1473.50 (-5.50) on the session. This marks a new low for the month of December and it is a month that can only be described as schizophrenic thus far.

Consider that this month has a significant historical upside bias and after early selling, the indices responded with a tremendous upside push. That push higher was unwound last Tuesday as the FOMC failed (in the market’s eyes) to respond appropriately to the current credit issues in the global market…throw in a little inflation fear and things are not looking as good as the buy side would have hoped.

Along these lines let us examine the movement post FOMC announcement and the subsequent joint injection of reserves by the chorus of global reserve banks. It is worth noting that in absolute value, it was the greatest move in the history of the SP futures from 1:30cst to the close and close to the 8:30 open on Wednesday…85 total SP POINTS. Since that time the indices have moved lower in a grinding fashion with each bounce failing to attract buyers at higher levels. With the SP now trading at -1.5% for the month and closing about the same distance below its 200 day MA (-1.5%) one has to wonder if the die has been cast and lower prices are ahead.

One thing that appears to be in store is a dialing down of intraday volatility. While the absolute moves have been large, the session range continues to tighten and for day traders that means to tread with caution. It is certainly worth pointing out that in the last 12 years there have only been 7 sessions with a high to low range of more than 45 SP points. The range on Dec. 11 was 56 points and on Dec. 12 46 points. The last time it happened was Jan. 3, 2001 (surprise mid-day rate cut), where a 46 point range was preceded by an 81. Clearly there is some position movement and it appears that the group that has blinked first is the long side.

KEEP IN MIND THAT TODAY AT 9:00 WE WILL HAVE THE FIRST AUCTION OF THE NEW “SYSTEM” ANNOUNCED LAST WEDNESDAY...ALSO TOMORROW BRINGS EARNINGS FROM GS (GOLDMAN SACHS) AND THIS IS QUADRUPLE WITCHING EXPIRATION WEEK.


Editors' Note: Brad Sullivan's comments are posted each day near the Cash Open in our SuperPlatinum Virtual Trading Room.

Friday, October 12, 2007

Equity Index Update (Special Edition)

Equity Index Update (Special Edition)SocialTwist Tell-a-Friend
Brad Sullivan

The index markets suffered through a sharp decline in the afternoon trade after a JP Morgan analyst cut revenue estimates for the Chinese Internet company BIDU (Baidu.com). The stock plunged from 358 per share to 303. Other staples of the momentum side also slid as GOOG dropped from a new all-time high of 641 to 622 on the close…AAPL fell sharply as did DRYS. The NQ market participants were clearly caught off guard as the index cratered from 2210 to 2160 in 30 minutes of trading…the subsequent bounce proved short lived and another round of selling pushed the index to the session lows of 2146 a solid -2% drop for the afternoon from high to low.


The interesting aspect of the decline was the second wave of selling. It was during this wave that the broader market came along for the ride on the downside…GS gave back its entire session from Tuesday’s FOMC minutes rally and the stock settled at 229. The examples of this type of price action were found everywhere by the close and one has to wonder if a confluence of forces that have been the underpinning of this rally (global growth, commodity boom, no inflation…so on so on) is being rethought. Certainly, a one day reversal should not cause a top in this long running bull market…and for the bears hoping that we have finally turned the cards over to the “sell” side of the ledger I would advise caution. There needs to be more technical work done on the downside in order to generate a price ceiling of significance. In the short run, it would appear that a rally back to yesterday’s highs would be a stretch. So…where does that leave us?

From a day trading perspective, much of the move was accomplished (at least in terms of velocity and price discovery) in yesterday’s swoon. The SPZ went BELOW the September Employment Report session low (1558.25) and some mild sell stops pushed the index to session lows of 1556.25. However, this low was still HIGHER than the GAP left from that very Employment report (1552.25). The subsequent short covering bounce into the close pushed the index towards 1565 – that close is on slightly lower on the week and does not represent the low close of the week as that was accomplished on Monday at 1562.75. In fact, only the NQ and ER2 contracts closed at new weekly lows. Essentially, this boils down to patience and a little bit of reality. Yes the markets are overextended and the fact that a revenue downgrade of a Chinese Internet company could put so much pressure on the marketplace proves that point. However, to make the leap from the trade in BIDU to an overall slowing of the China Story may be a bit of a stretch. In my opinion, we witnessed a rare news event that led to a bit of a buyers strike. Whether or not that continues today will be fascinating, particularly as we head into earnings season. My advice is to lay low and look for a few opportunities, particularly early, for selling rallies. Psychologically the market took a hit and some of that should carry into today.

Monday, June 25, 2007

A note from Brad Sullivan

A note from Brad SullivanSocialTwist Tell-a-Friend
Dear Friends,

I would like to announce that earlier this month I accepted a trading position at a proprietary firm here in Chicago and will no longer be able to appear in the HA Virtual Trading Room for live commentary. From a subscriber point of view, this clearly comes out of left field, yet I felt this opportunity to be too good to pass up.

As a compromise, I will supply Hamzei Analytics with my morning commentary and two intraday updates to be posted in the SuperPlatinum Virtual Trading Room only. Feel free to continue emailing any questions or comments to brad@group6trading.com.

I have enjoyed our trading discussions online and believe that we have created a unique venture within our virtual trading room. While I may not be on the screen each day, you will have my market thoughts and feedback throughout the session, albeit in a different format.

Thanks for all the fun over the past several years,

Brad

Thursday, May 31, 2007

Equity Index Update

Equity Index UpdateSocialTwist Tell-a-Friend
Brad Sullivan

The index markets reversed overnight worries from a Chinese decline and pushed significantly higher. In fact, the SPX joined the All-Time High Club as the index finally pushed through the 1527ish previous high close registered in March of 2000. Now the index has the intraday highs of 1552 and change in its sights. Without question yesterday’s sharp move caught many traders flat-footed. Given the China news, and the fact that this time there was a catalyst for the decline (raising the stamp tax on stock transactions from 0.1 to 0.3%) it should have come as no surprise that the indices were not going back down the Feb. 27th path. However, to predict new highs across much of the board was not something many were thinking when the SPM was trading around 1516.

And there lies the proverbial rub of the index trade in our current climate. By most measures we are overvalued/stretched and should be looking for a moderate decline. However, the indices keep on chugging higher and for those fighting the tape it has been a painful experience both psychologically and financially. As I pointed out last week in a couple of comments, the indices were stretched on a variety of readings…normally this plays out 1 of 2 ways: either a sharp decline or a moderate decline followed by sideways action. Neither of these scenarios is playing out. The decline was shallow, but only a couple of sessions of range oriented action followed. This leaves me with a scenario that rarely comes into play and that is the blow-off rally. Simply put, the DJIA and SPX have POTENTIAL to stretch this rally significantly higher throughout the summer. There are now 3 options on the board and it should make for some very interesting trading over the next 6 to 8 weeks.

For today’s session here are the levels in SPM I am focusing on: The first area of resistance should be found between 1535.50 and 1537.50…above this look for a push towards 1541. I would be looking for the zone between 1540.50 and 1542.50 to establish a moderate short line. Above 1545 on a 30 minute close, the white flag is waived on this transaction.

On the downside, support should be found in our old resistance zone of the low 1530’s…essentially look for support between 1533.50 to 1531. If this zone fails to hold, look for selling to accelerate towards 1528. Support is found within the 1529 to 1527 zone and again from 1525 to 1524. Clearly any move towards this area would leave many scratching heads.

All told, with the month end and tomorrow’s employment report, I would asses the odds of a significant move higher or lower as remote. Keep it close to the vest, but be ready to play if something changes during the session.

Friday, May 25, 2007

Equity Index Update

Equity Index UpdateSocialTwist Tell-a-Friend
Brad Sullivan

The index markets took a spill yesterday on heavy volume. The SPM opened in my support zone between 1524 and 1526, quickly finding a bid just before the release of New Home Sales which rose by a staggering +16% and well outside the highest end of expectations. Accordingly, players bid the indices in the wake of this number…however; the key resistance area in the low 1530’s put a ceiling on the session. Once the day trade longs were forced to liquidate the downside picked up some serious momentum and pushed through a variety of support zones established in the last two weeks of trading. Program trades were the flavor of the session as -1000 readings on the NYSE TICK were plentiful. When the session ended, with a minor bounce off the session lows, the SPM lost -13.50 for the session. However, measured from high to low on the session, the contract fell nearly -25.00.

This morning the indices are called to open higher as Europe remains moderately higher for its session. The SPM is trading at 1515.50, up 4.00 on the session and +5.20 above fair value readings. Keep a close eye on the 1515-1518.50 zone as the trade unwinds this morning. Early closing in the US debt markets should leave many traders heading out for the weekend after the first hour of trading. Accordingly, keep a close eye on some volatile trading during this period. In addition…if I hear one more pundit on CNBC talk about the bond market and the 10yr. yield approaching 5% being the reason for equities reversing course yesterday I may have to turn it off for good. During the past four years, yields have generally moved higher while equities have taken off to the upside. Now…if we were to push the 10yr to 5.25% in a velocity driven/inflation fighting trade – THEN I would say the yields are impacting equities. Until then, too many people looking for a reason that the indices broke -2% from All-Time highs.

Here are my levels for today’s session in the SPM contract: On the upside we are scheduled to open in the 1515 to 1518.50 zone…this zone is acting as resistance once again and only a 30 minute close ABOVE 1520 will change that picture. If we were to push above 1520 on a 30 minute basis I would not chase em up. Rather, the picture would become mixed for the rest of the session. Given the anti-upside momentum that I outlined yesterday, we could very well hit the 1524 to 1526 zone and fail there. In other words, rally selling remains the key in the short term.

Equity Index Update

Equity Index UpdateSocialTwist Tell-a-Friend
Brad Sullivan
Thursday May 24, 2007

The SPX index failed to close above the All-Time High close yesterday, and for the third consecutive session this index could not generate any “follow” buying. Accordingly, late selling has hit the market each session, pushing the index below its ATH close from March of 2000. The question on everybody’s mind is pretty simple…are we beginning to move into a resistance area that will hold prices down for the next few weeks?

On any technical measurement, the indices are clearly overbought – IN THE SHORT TERM. Consider the performance of the major indices from their respective March trading lows (seems so long ago doesn’t it?) to their recent highs. The DJIA is up about +12.8%, the Midcap 400 is up 11.5%, the SPX is up 11.2%, the NDX is up 9.9% and the Russell 2000 is higher by +8.8%. All of this taking place in about 9 trading weeks. That is a tremendous rally in both net change and velocity (measured in time). The odds are favoring a pause/contraction/slowing of this move. However, let’s keep in mind that ODDS only tell part of the story and if this is a stealth/blow off move to the upside there is plenty of room left in higher price zones.

As for today’s trade, the housing reading at 9:00cst should add some intraday volatility and the Durable Goods reading was able to push the SPM from -2.50 at 1523 to the current +0.50 at 1526. In addition, all eyes remain squarely focused on the holiday coming up this weekend as well as any happenings in China, where it appears that Mr.Greenspan does not have the same pull as he did several years ago. His overtly bearish comments on the Chinese market produced a settlement of -0.5% in their session…not exactly the earth shaking response one would anticipate.

Here are my levels for the SPM today…We are called to open within my key support zone from 1524 to 1526, I anticipate this zone to be the transitional area for a red light/green light type of session. Above it, is green light (buying) and below it is red light (selling). Above this zone we should hit resistance between the 1528.50 and 1530 area, followed by 1532.50 to 1534. The levels above 1528.50 have been probed for 3 consecutive sessions with yesterday’s action creating a new contract high…however, the failure to close any of these 3 sessions in positive territory has to be considered a NEGATIVE. Whether or not strong selling appears at LOWER pricing zones remains to be found, however, what should be important from a trading perspective is the ability to sell this market in the lower 1530’s for a move lower by the close of trading. In other words, we are not finding a boat of sellers at 1520 (assuming we get there) but we are finding them at 1533. It is the opposite of momentum, one in which a trader can sell higher highs and profit. Keep this thought in mind the next two sessions.

On the downside…below the opening support zone, 1522 to 1520 is CRITICAL support. If we move below this zone on a 30 minute closing basis it should create a trade towards the bottom end of the old resistance zone 1518.50-1515. That zone is now neutral/transition…below this is key support between 1512.50 and 1510. Barring an outlier news event, I see no reason to chase ‘em down below this level.

I have included a chart on the DJIA and its 200 day MA “extension.” We are holding at the highest levels since the start of 2006, but more importantly, the highest levels since the 1980’s. Is this a sell signal? Possibly, but remember this…in 1999 the NDX went to +51% above its 200 day MA.


Wednesday, May 23, 2007

Equity Index Update

Equity Index UpdateSocialTwist Tell-a-Friend
Brad Sullivan

The indices continued their divergent path in yesterday’s session and for those that use one index as a lead indicator to trade another index, it has been nothing but a painful existence over the past couple of weeks. Indeed, the only game in town right now is the spread trade between the mega-caps (DJ and SP) versus the small caps (ER2) and to some extent the NDX. As I outlined earlier this week, the volatility has been nothing short of amazing in these spreads, and the highest levels I have seen since the run higher in 1999 and subsequent collapse in the NDX. Rumors continue to abound about the trade over the last two weeks in these spreads, but, the only thing that really seems to matter is what we examined the other day with a couple of spread charts. Simply put, it was “mean-reversion” time. The last 2 sessions have been a painful reminder of how these spreads can operate – at least for those that stayed too long at the party. I have included an updated table that I first put into Monday’s update and a chart to show the extremes.


This morning, the SPM is trading higher on the heels of another +1% rally in China (why I’m not long the great wall I’ll never know) and more all-time highs in the DAX. Currently the SPM is trading at 1531.50, up 6.50 on the session – just shy of yesterday’s high and contract highs. Without any hint of economic today, save the DOE weekly inventories, one has to wonder -- is today finally the day the SPX takes out its All-time closing high?

The SPM was a pretty interesting trade yesterday as the market attempted to consolidate below my key 1528 level, but could not muster any sustained selling and gradually firmed up between 1527 and 1529. Lunchtime provided a bid and pushed the market a bit higher…however, by the time the final hour was underway the index could not hold onto the gains. In the final 30 minutes of trading the contract was sold into the bell, producing a new session low at 1524.75. Much of this seemed to be spread related and day trade long selling. This theory has gained traction in my mind with today’s solid open higher. Now the question becomes…where do we go from here?

Here are my levels for the SPM today: On the upside…resistance should be found between 1531.50 and 1534.50…if we can get a 30 minute close above this zone it is bullish. However, I do not think one need’s to chase ‘em up. Instead wait for a move back into this zone (31.50 and 34.50) to build up a long position that pushes towards the 1538 level. Stopping points along the way should be 1535.50-1536, then strong resistance between 1538 and 1541. IF THE SPM TRADES ABOVE THE RESISTANCE ZONE (31.50-34.50) AND DOES NOT COME BACK IN…CANCEL THE IDEA OF BIDDING IN THAT ZONE. In other words…if we trade up to 1538, I don’t want ‘em back at 1532.

On the support side…1530-1527 is a transition zone. It should provide support, but, not support that one utilizes to get long. 1526 to 1524 remains key support and should be used to establish buying points…below this 1522.50 to 1520 is CRITICAL. Only a 30 minute close below 1520 turns the switch to “sell” and even then it most likely will be tomorrow or Friday that the trade comes to fruition. In other words…don’t chase lows below 1520 to establish a position.

All told, volatility is already on its holiday and one needs to be cautious in this trading environment.


Tuesday, May 22, 2007

Equity Index Update

Equity Index UpdateSocialTwist Tell-a-Friend
Brad Sullivan

The index markets continued their ascent into higher ground yesterday for much of the session. However, a late reversal in large cap oil issues seemed to bring an overall sale to the large cap indices. When it was over the SPM had dropped from its new contract high area of 1534 to its session low of 1526.50 before rebounding a touch at settlement. In addition the DJIA fell for what feels like the first time in about one year. However, the big story continues to be the action in the spreading between the various indices.

Yesterday, the ER2 and NQ rallied sharply. The spreads which I discussed at length yesterday – DJIA vs. Russell 2k, SP vs. Russell 2k – gave back a substantial portion of last week’s gains. How volatile was the spread action? Consider this a 1 unit spread of long 11 DJI minis and short -9 Er2 minis lost a WHOPPING -$10,540 ON THE DAY. The Spread trade of Long 10 SP minis and short -9 ER2 minis lost -$9,250. I CANNOT EMPHASIZE ENOUGH…THESE MOVES ARE OUTSIDE THE “NORMALIZED” PARAMETERS. To use option jargon…the tails are pretty fat in these spreads right now. I would associate this with someone, or a group of somebody’s being take to the shed and forced to cover this spread. Typically, when such a move happens, the size player on the wrong side of the bet is forced to pay up in order to get out. Whether or not this has been the reason for the dramatic move in these spreads is a bit of conjecture and rumor mongering. And, most importantly, it does not begin to tell the whole story about what is actually happening in the mega-cap arena. The bullish move in the mega-caps continues to play out on a liquidity driven theme…as traders our job is stay in touch with that theme. Final hour moves like yesterday afternoon tend to make one think that the “to is in.” Yet, for all these final hour sales…the market continues to find its way to higher ground. Keep this thought in mind when hitting bids.

I had a resistance zone yesterday that encompassed the 1528 to 1531 levels…the SPM gradually carved through that zone in the late morning and continued to hold above it as the CASH index made it above the 1527ish AT closing high…however, the market could not sustain the buying interest at the highs. Around 1:45 cst the SPM made another push to get above 1534 and failed…this time day trade longs ran for the exits creating a pretty good selling vacuum. That move pushed the SPM towards the morning and session low of 1526.50, before a slight bounce into the bell. The CASH index missed closing at AT high levels by a couple of points. The question today is this…will there be more selling?

Here are my levels for today’s trading in the SPM…on the Upside : Resistance should be found between 1530.50 and 1531, above this 1532.75 to 1534.50 is CRITICAL. If the contract can get a 30 minute close above this zone, it should produce a “walk em up” type of trade towards 1538.50. If long…I would look to exit between 1538 and 1541 as this zone will be difficult to push through for the contract.

On the downside…I have a neutral zone between 1530 and 1528. A 30 minute close below this neutral zone should provide a push lower. 1526 to 1524 remains a support zone and will be difficult to close below on a 30 minute basis. However, I would look for some “spike” oriented selling that would push the index towards 1522 before bouncing. Support is found at 1523.50, then 1522.25 to 1520. Any 30 minute close below 1520 and things will get interesting…however, much of that interest will most likely be tomorrow and Thursday. I suspect that below 1520 and we will have pushed as far as possible for today’s session.

Disclaimer and Terms of Service

© Copyright 1998-2023, Hamzei Analytics, LLC. Hamzei Financial Network is published by Hamzei Analytics, LLC, Naples, FL 34112, Admin@HamzeiAnalytics.com (310) 306-1200. The information herein was obtained from sources which Hamzei Analytics, LLC believes are reliable, but we can not and do not guarantee its accuracy. None of the information, advertisements, website links, or any opinions expressed constitutes a solicitation of the purchase or sale of any securities or commodities. Please note that Hamzei Analytics, LLC or its principals may already have invested or may from time to time invest in securities or commodities that are recommended or otherwise covered on this website. Neither Hamzei Analytics, LLC nor its principals intend to disclose the extent of any current holdings or future transactions with respect to any particular security or commodity. You should consider this possibility before investing in any security or commodity based upon statements and information contained in any report, post, comment or recommendation you receive from us. The content on this site is provided as general information only and should not be taken as investment or trading advice. Any action that you take as a result of information, analysis, or conclusion on this site is ultimately your responsibility. Always consult your financial adviser(s) before making any investment or trading decisions.