Showing posts with label Sally Limantour. Show all posts

Tuesday, February 27, 2007

Risk Aversion Behavior

Risk Aversion BehaviorSocialTwist Tell-a-Friend
Sally Limantour

The biggest news today is the 9% collapse in China’s share prices. The People’s Bank of China’s decision to raise the discount rate one more time in the day prior to the Lunar New Year is piercing the bubble in what is the largest sell off in more than a decade.
We are coming into the market with this spreading globally and the S&P down .93% and the NQ down 1.66%. The mini S&P just went through the support level I mentioned on my 12/23/07 update of 1440.00. We also had a very weak durable goods number this morning coupled with the Greenspan “R” word in our collective psyche’s, the sub prime worries and geopolitical concerns.

Earlier this month Mr. Cheng Siwei, the Vice Chairman of the National People’s Congress, said the speculative rise in share prices was a “bubble” and that investors need to be concerned about the risks in the stock market.

In the FT he said, “In a bull market people will invest relatively irrationally. Every investor thinks they can win. But many will end up losing.That is their risk and their choice.” The question on everyone’s mind this morning is whether the liquidity spigot will turn to a slow drip as huge capital inflows from China has allowed excess capital to move globally propping up stock markets everywhere. Or… to we do what has been working for so long which is to buy the breaks.

This morning has the taste of fear and liquidation. My first good support in ESH7 comes in at 1229.50. As mentioned yesterday, after having my shortest term model on a sell for a week, it went back to long and many people emailed asking how to I use this model. I use it for day trading only- no overnight positions in this timeframe. If it is flashing a sell, I tend to be more aggressive on selling during the day. If it is in a buy mode, I will more actively pursue the long side on breaks which is what I did yesterday. All last week, starting on Friday Feb 16th, the sell signal was predominant so my strategy was to sell rallies until yesterday. Coming in today on this short term model I am flat and it has turned back to the sell mode.
This does not mean to come in and sell the ESH7 at the open, but to watch and see if there will be any good intraday opportunities to go short. Obviously as a day trader I may pursue the long side on a sharp spike down to that 1429.00 area, but will see how the day unfolds.

Given the current risk aversion playing out across global equity markets coupled with my medium term indicators warning of a high probability of risk aversion behavior this is not a time to be buying dips aggressively and holding in my opinion. We have had a one way market for most global equities since June/July 2006 and the cracks are starting to appear.
Long volatility positions in the stock indices mentioned weeks ago were established as a way to capture a potential wave of risk aversion for the next few months.

Going forward should this turn into a more meaningful sell off we have to assess how this will carry into other asset classes that have benefited from
this global infusion of capital, such as the commodity sector. The metals are taking a hit from this as is the dollar. Bonds, however are benefiting from this and exhibiting the flight to quality behavior as we approach key resistance levels in the June bonds of 112.20-113.00. Currently, I am holding off on short positions in bonds and tightening stops on most commodity long positions.

Monday, February 26, 2007

S&P and Commodity Prices

S&P and Commodity PricesSocialTwist Tell-a-Friend
Sally Limantour

The S&P had a small loss last week falling 0.25% with concerns over the sub prime lenders, rising inflation and geopolitical issues in the Middle East. Friday’s reading on the put to call ratio was its highest since September ’06 as investors put in place considerable downside protection against a much anticipated sell-off. My shortest term model covered shorts on Friday and is now on a short term buy signal. Perhaps we will see a near term short squeeze. Holding above the 1454 – 1456.00 (ESH mini- S&P) is supportive and recapturing the 1462 could ignite another round of fresh buying.

Today in what would be the largest private equity buy-out on record we have news that the board of TXU, the largest power producer in Texas met to approve a 45bn (IHT reports it is a $32bn deal while FT reports $45bn) takeover by Kohlberg Kravis Roberts and Texas Pacific Group. Part of the agreement is to sharply scale back TXU’s $10bn plan to build 11 new coal fired power plants that would produce noxious greenhouse gas emissions.
Everything is green – Al Gore, the Oscars and corporate America.

Commodities rose across the board lead by precious and base metals, crude oil and grains. Crude oil is now up 4.6% for the month with gold up 4.4%, corn up 6.6% and nickel up 12.3%. Even Jim Cramer is getting nervous about gold prices saying that higher prices could be “kryptonite to stocks if it goes to $710-$720.

It is a broad based rally in the commodity sector which is healthy, but it is stoking the inflationary fears. Treasury inflation-protected securities, or TIPS, have returned 1.15% so far this year, versus a loss of 0.3% last year. Investors are hedging their bets as inflation remains a “predominant concern” for the Fed. Higher commodity prices seep into everything – even beer! FT reports, “Blow for beer as biofuels clean out barley.” The demand for biofuel feedstocks such as corn, rapeseed and soybeans is encouraging farmers to plant these crops instead of grains, like barley. Heineken warned last week that the expansion of the biofuel sector was beginning to cause a “structural shift” in European and US agricultural markets.

While I have read a few articles claiming the commodity sector is running out of steam, I think it is beginning another leg up in its bull market. Billions of new people are entering the market and like all human beings, they want to move up the food chain, not down.

Friday, February 23, 2007

Treasury Bonds & S&P

Treasury Bonds & S&PSocialTwist Tell-a-Friend
Sally Limantour
February 23, 2007

Treasury markets have retreated with all of the inflationary talk and concerns off the CPI report coupled with the strong rally in many commodity markets this week has the bond bulls a bit spooked. It was interesting to hear Bill Gross of Pimco announce a change of heart in that he is reducing his bond holdings and raising cash. He has called for a weaker economy for quite a while and now is so disenchanted with US debt markets that he has raised his holdings of cash equivalent securities to the highest level in almost 2 years - up 26%, or now 43% of the 99.9 billion. Action: continue to sell rallies in the bond market

The S&P had a good range day yesterday but unable to hold the highs. For the majority of the week the smart thing has been to buy the breaks with the
market continuing to drift back to the “point of control” area of 1457.50-1458.00 (basis ESH- mini S&P). My shortest term model continues to flash a sell since last Friday, so selling the strong rallies here has been my strategy this week. Medium term model remains neutral but the risk adverse signal continues to build higher. It still appears the goldilocks theme is the background with money flows healthy and liquidity ample. Yesterday the Kansas City Federal Reserve Bank had a much stronger survey (+31) than expected reflecting strong new orders, employment and shipments. In addition, the IFO dialogue overnight suggests that growth in the Euro zone is not expected to end. The main threats going forward in the near term would be interest rate/inflation fears, geopolitical concerns (Iran jitters and another ship sent in yesterday) and anxiety towards the sub prime lending resurfacing after Lloyd’s TSB’s badly received figures. Rising oil prices too are on our radar.

Outside-the- range numbers for ES H7 are now 1475.75 on the upside and 1440.50 on the downside with today’s value area falling between
1461-1455.50

Tuesday, February 20, 2007

Interest Rates

Interest RatesSocialTwist Tell-a-Friend
Sally Limantour
February 20, 2007

We had a long weekend to digest Mr. Bernanke’s statements and his views on unemployment and inflation were telling. The Fed’s forecast for unemployment for the next two years is for the rate to remain between 4.5-4.75 per cent –right where it is. My interpretation is that he feels the economy is in a sweet spot and employment is good enough to keep the politicians at bay while foreign wage competition is dampening inflation potential of strong employment.

While Bernanke spoke of the downside risks of housing, he also said, “To the upside output may expand more quickly than expected.” This translates to mean that there is a chance for a stronger economy. Had he left this statement out, Treasury Bond Futures (US H7) may have closed the week closer to or above the 11200 level.


We have a slew of Fed speeches this week (this could restore rate hike fears) and CPI due out on Tuesday. While the Fed will focus on the core PCE Index, it is interesting to look at expected CPI as a general guide. The difference between the yield on a 10-year Treasury Note and the yield on an Inflation-Protected 10 year Treasury Note is basically the bond market’s forecast of the US CPI’s future rate of change. According to Ray Hanson, of the Speculative Investor, over the last 3.5 years expected CPI has been in a range of 2.25%-2.70%. “In other words, over the past 3.5 years there has been neither a deflation nor an inflation scare” hence, the Goldilocks economy and the strong stock market. Were we to break out of this range on the upside, rates would tighten and the stock market would suffer. On the downside deflationary concerns would spark interest rates to fall and commodity markets would be spooked. This brings me to the central banks and the current problems they face today in assessing “stability.”


Historically, central banks attempt to achieve stability by looking at changes in interest rates against measures of the amount of spare capacity within an economy. If interest rates can be moved to set demand at a level consistent with “supply potential”, then central banks will achieve stability.

Another more familiar approach is for central banks to monitor money supply growth in order to gauge inflation. These two models have worked well in the past but with globalization the central banks seem to be having a more difficult time measuring inflation and determining stability. In The Independent, 02/20/07, Stephen King wrote about the problems central banks are having with measuring the economy using an old paradigm in a world of increasing globalization.

The first approach has inherent problems in that countries dealing with large scale immigration are trying to figure out the size of supply potential. “The Bank of England, for example, has to fret about the scale of labour immigration. It knows the scale of recent immigration has been big, but beyond that, information is sketchy.”

The second problem is with measuring money supply. At the touch of a button and with the speed of light capital is flowing across borders while bank deposits are switching from one jurisdiction to the other making it difficult to know the “real” level of money supply. Perhaps this is one reason why the Fed stopped reporting M3? It may also explain why it has been difficult for traders to get a handle on interest rates – remember how bullish the market was towards a decrease in interest rates only to see them move higher? Market expectations have changed often over the last 12 months and the transparency the central banks are offering may in fact, be “revealing the uncertainties” they are confronting.

Readers in the Hamzei Analytics' Virtual Trading Room know I have been a seller of Treasury Bond Futures since Nov-Dec 2006– selling rallies and buying back on dips. After trading down to the low 110 area I have been flat looking to sell 11200 – 11208. In the big picture I believe we are in an upward multi-year trend in interest rates which will take years to develop.

Keep a heads up this week with regard to Fed speakers, Govenors Kohn, Bies, and regional Presidents Yellen and Fisher. Tuesday’s CPI number and the BOJ rate decision are also potential market movers. In addition, stay alert to more talk of a potential credit crunch precipitated by the housing downturn and rising default rates.

Monday, February 12, 2007

Currencies and Equity Indices

Currencies and Equity IndicesSocialTwist Tell-a-Friend
Sally Limantour
February 12, 2007

The G7 meeting is behind us and those wishing to ride the carry trade train still have a green light as there was little in the way of direct criticism, but certainly ongoing warnings of the risk. At what point these warnings become an outright threat is tough to determine. It seems it is business as usual unless we either get intervention by one party or another, coordinated intervention or some type of regulation/taxation of carry trades.

Given the continued sell off in the Yen, the seasonal weakness into April and the Commitment of Traders on the neutral side, there is still more downside with 81.50 the next target. However, March madness is set to begin and this is the time of year when traders say the yen always rises at the end of the fiscal year due to repatriation flows. It is not necessarily true, but the perception gets a lot of attention. A bear trap rally coming soon? Stay tuned…

The dollar is well bid this morning following Treasury Secretary Paulson’s message in Germany, “a strong dollar is in the interest of our country.” Here we go again, echoing the mantra of other Goldman Sachs folks who moved into the Treasury. The dollar is also reacting to Finance Minister Kamal saying Qatar is not going to turn away from the dollar and price energy in terms of Euro. Finally, we had the Fed’s Poole and Pinalto both voicing concerns about inflation which has bonds on the defensive and the dollar strengthening. We are once again flirting with the 85.00 level in the dollar index and my guess is we may push through it this time.

The stock market finally had a slight move in volatility and a decent reversal/sell off on Friday. My short-term model is still on a sell signal. Medium and long term indicators do not warn of a wave of risk aversion, but they are building towards a high level. Short positions were established in different indices (ES, NQ, ER2) as we hit my resistance area stated last Tuesday ( 1458-1460). The high was 1457.75 and that was close enough. The fact that early Friday morning proved the 1457 area to formidable resistance made the short position a bit more favorable. Possible targets on the downside are 1434, 1425 – 1429.50. A key area coming in today is the 1446 area and closes above 1452.50 should negate the short-term picture.

The HSBC Holdings and New Century Financial news are in the background causing concerns for the housing industry as is the Thursday report from Dresdner, "The Great Unwind is Coming," FT02/09/07, which was a detailed report detailing the negative properties inherent in many hedge funds.

This Wednesday and Thursday, Fed Chairman Ben Bernanke (more affectionally known in our circles as "Uncle Ben") provides the semi-annual report to Congress. We have economic data filtering in starting on Wednesday and more on Thursday and Friday. Given the Fed is “data dependent” I guess we should be too. It will be curious to see if we reject/accept the first resistance area of 1445.50-1446 early today and how the market behaves going into Wednesday.

Here is my favorite quote over the weekend, “We are not selling a meal – we are selling a whole experience. You cannot put a price on it.” This form the manager of Mezzaluna restaurant in Bangkok justifying the 1 million Baht, or $29,240 meal for the Epicurean Masters of the World II dinner. I was not invited, but I love to see the menu.

Friday, February 9, 2007

Inflationary Concerns

Inflationary ConcernsSocialTwist Tell-a-Friend
Sally Limantour
February 9, 2007

A heavy flow of US Fed dialogue today could rekindle inflationary concerns. The Fed’s Poole is speaking now (7:45 am) and Fed Fisher at noon. With oil prices strong the March crude oil punched through that quasi triple top of 60 yesterday and gold seems to have solid footing now above the $650 level. There are a number of bullish themes for gold right now. First, as mentioned on Feb 7th, the European legacy banks are selling far less gold to meet the quotas of the Washington Agreement. The IMF is considering selling a “limited amount of gold” and in the past six to seven weeks the monetary base has exploded to the upside rising approximately $18 billion since the last week of December.

Bill Fleckenstein(http://www.fleckensteincapital.com/) wrote, Golden Glad Tidings? On the subject of gold, I received an email from a friend who said…

“The China Gold Association is claiming that the country plans to raise reserves by 3,500 tons over the next five years. (The Washington Accord selling agreement is 2,500 tons).
If that is true, we finally have hit the moment that I thought we’d eventually see – which is that Asia’s dollar-buyers of last resort are finally voting to exchange them for gold. They are willing to give them to the “European legacy banks”, which up until now have been so willing to part with their gold, though judging from the recent data I shared yesterday, they may be a little less excited about selling it than they once were.”

Let us remember not to just look at gold in US dollar terms. In other currencies, such as the South African Rand gold is breaking out. Gold denominated in Japanese Yen has gold moving to a new multi-year high.

Thursday, February 8, 2007

Volatility

VolatilitySocialTwist Tell-a-Friend
Sally Limantour
February 8, 2007

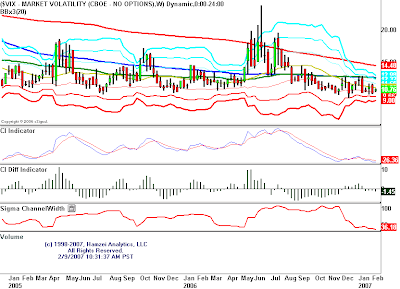
Volatility or the lack of is on everyone’s mind. On CNBC early this morning they played the theme song from Jaws with the title, IS VOLATILITY COMING BACK – then phased out to a commercial. The NYT on Feb 3rd had an article IT’S CALM. LOOK OUT FOR A STORM. “If complacency breeds danger, then we might be sitting on a powder keg heading into 2007,” James Stack, editor of, Invest Tech Market Analyst.

The low reading in volatility which is trading close to record lows set in 1994 is comforting to many. A belief that the evolution of financial products makes the stock market inherently less volatile than it use to be is becoming its own mantra.

“People are very worried about risk,” says Tobias Levkovich, equity strategist at Citigroup Investment Research, and the fact that so many investors are focusing attention on volatility is another reason not to be concerned.

I see the logic in all of this – being concerned, not being concerned, being indifferent about being concerned all over this concept of volatility. My gut feel is this is going to be a volatile year. I have my reasons why and began putting on volatility strategies last week. We shall see…

Bonds

Dr. Plosser tried to crash the party yesterday with talk of higher rates. At the heart of his antinflationary remarks is a fear that labor costs are about to advance. The market remains well bid and shorts established two weeks ago were covered yesterday. Perhaps a light upward bias will take bonds back to 112 00, though I would be a seller there. You have a sector of the trade questioning overall growth prospects ahead and then you have the non-farm productivity up 3.0% annual rate in 4th quarter which was far better than the consensus of 2.0% (non-farm payrolls for all of 2006 rose 2.1%).

Stock Indexes

HSBC has warned that debts will be higher than the consensus due to further deterioration in third-party originated sub-prime mortgages in the US. Disney had impressive earnings and while I think we are building toward a correction you cannot argue with the pretty charts. The mid-cap and small caps are leading the market and that is usually a positive development. The NASDAQ is the only major index that has not set a new high this month. February typically is one of the worst performers, but seasonal tendencies cannot always be trusted nor followed. Trade with caution and perhaps tighten the stops.

Wednesday, February 7, 2007

Fed, Bonds and Gold

Fed, Bonds and GoldSocialTwist Tell-a-Friend
Sally Limantour
February 7, 2007

Treasury Bonds:

“Fed Ease Unlikely Until 2008,” said Richard Berner, from Morgan Stanley. So now we have gone from an expected easing in early 2007, to easing late in the year to a possible easing in 2008. The reason: “We think future inflation risks are slightly higher than a month ago.”
(www.morganstanley.com/views/gef/archive/2007/20070205-Mon.html#anchor4338)

The Fed speakers were out in force yesterday with San Francisco Fed President Janet Yellen saying “inflation is a little higher than I would like it to be; I would like inflation to come down.” The bond market had a short covering rally and stops above the 110 15/32 area were triggered. Strong demand for the 3 year and the “slowing” rate of growth predictions by a number of Wall Street economists contributed to this. Certainly $60 oil is also on everyone’s radar.

Bottom-line: Resistance above the 111-00 will keep the bears in control.

GOLD:

The media is focused on the gold rally inspired by the energy price inflation theme. I am more interested in the fact that gold sales by legacy central banks of Europe are low. In order to meet the Washington Agreement’s annual gold sales total they need to sell 9.6 tonnes each and every week. We are now in the 7th consecutive week that the legacy central banks have sold less than 3 tonnes of gold. This is bullish and an important item to monitor.

In other news:

Goldman sells top commodities index. GS has agreed to sell its GSCI commodity index to Standard & Poor’s for an undisclosed amount, according to the FT today. Note this: “the move will give the S&P a potentially powerful influence on commodity markets as any changes to the index composition can have wide ramifications for underlying commodity prices. The GSCI, the world’s leading commodity index, has about $60 bn tracking it. Most of these funds are managed by GS, which is the largest commodities trader among investment banks.”

Regarding the grain and soybean market there is much talk of expected planting and how much will be shifted to corn, given the high prices. While bullish on this sector, I have stepped to the sidelines as I am seeing a dis-connect between the futures and the cash market.

Tuesday, February 6, 2007

SP500, Grains, Cotton and Base Metals

SP500, Grains, Cotton and Base MetalsSocialTwist Tell-a-Friend
Sally Limantour
February 6, 2007

In stock land we have little data this week, but keep your eye on budget headlines coming from Washington. The bears are gun she and rightfully so. That said, as mentioned last Friday, my short-term proprietary model is signaling a sell for early this week. This does not mean a top, just a short tem correction and with that in mind, I will look to short ESH 1458-1460 with stops over 1464.

The grain markets and cotton, my two favorite sectors for 2007 continue to act well. We have corn (March) trading over $4.00 a bushel and new crop beans (November) trading over $7.75 a bushel. Corn did fill its gap from 1/12/07 and long positions were re-established last Friday in the $3.95 area. With the $4.00 level for new crop corn, farmers are going to plant more corn this spring which will take away acreage from soybeans. The new crop beans are outperforming due to this and with the bean to corn ratio at 2.1 this creates a huge incentive for the farmers to plant corn.

Cotton has been sleeping, but woke up yesterday to close up +1.32%. I am still holding long positions from December (52.50) and with talk of reduced acreage (13.2 vs. 15.2 year ago) we may see the fund buying especially if we start to see prices breakout above 56.00.

There were reports last Friday that the large hedge fund, Red Kite (a $1 bn metals-trading fund) had hit trouble and copper prices fell 4.8%. Nickel and zinc were also down in London and perhaps that could explain the $19.00 sell off in gold (from Thurs. high to Friday’s low). It was a buying opportunity in silver and gold and I continue to think the precious metals will outperform.

Red Kite has brought out some speculation concerning the base metals. One report put the London firm down as much as 20 per cent in the first 3 weeks of January, leading to forced liquidation of copper, zinc and other base metals. In an attempt to prevent a stampede for the door among their investors, the fund requested approval for an amendment to extend 45 days from 15 the notice required for investors to withdraw their money. As the FT reports, “that smacks of the proverbial horse having already bolted.”

This has prompted the question on the role of commodities funds in driving up prices – and how that picture might unravel. Questions from the Markets Risk blog are, “What happens when the hedge funds who bid up prices in global assets start to get investor redemptions because of poor performance? What happens when the leverage unwinds and managers with little experience managing systemic or core market risks are faced with “improbable” risks?”

Answer: massive liquidations. It is estimated that more than 500 hedge funds specializing in commodities have started in the last 2-3 years. These funds represent a large percentage of the trading volume of base metals financial derivatives and it makes you wonder just how much of the 146% rise in copper prices from late 2005 to May 2006 was due to physical demand (China?) and how much was due to leveraged hedge fund derivative speculation. Perhaps a bit of both.

Remember to use stops!

Monday, February 5, 2007

The Carry Trade

The Carry TradeSocialTwist Tell-a-Friend
Sally Limantour
February 4, 2007

The yen was in the spotlight last week and volatility increased as speculation about the currency’s fragility would be a topic of concern with the G7 meeting. Hank Paulsen, the US Treasury Secretary added fuel to the fire when he told the US Senate last Wednesday that he was watching the Japanese currency “very, very closely.” The yen rallied right after these remarks. On Thursday, he came out and said that he did not think the yen was at an artificial level or had been influenced by political pressures which caused the yen to sell off. Political volatility is a dangerous game.

Japanese interest rates are at rock bottom and while concerns of deflation are being talked down, there does not seem to be a compelling reason for the BOJ to raise rates. The perception that rates and the yen will stay low is fueling the carry trade where any hedge fund can borrow in yen, invest in something with a higher yield, apply some leverage and achieve returns of 20 per cent or more. How long this game can go on is an important question as the unwinding of this carry trade could affect many different markets when it occurs.

Different analysts try to estimate the total size of the carry trade, but it seems a daunting task. Some economists guess at about $35 billion, while pi Economics (www.pieconomics.com), in their research report, The Credit Bubble and the Yen, thinks it is more like $1,000 billion. The yen has thus been labeled the “ATM of the global credit world.”

It is not just hedge funds, but investment banks and other institutions that fund their deals with ultra cheap yen. Most of them do not seem worried as they are betting that Japan’s economic recovery will be slow, thereby keeping the yen weak and the carry trade alive and well. There are also too many interest groups that oppose a stronger yen.

Market volatility has been low making it cheap to use derivatives to insure against the risk of a rising yen. As a result, many hedge funds are buying protection against a stronger yen while playing the carry trade game. In a recent letter to the FT, Vineer Bhanasali, Executive Vice President of Pimco recently commented on this, “low volatility and high carry pairs -is due to “invisible hand” collusion between sellers of exchange rate volatility via options (everyone is selling options as a means to generate income in their portfolios, including many of the central banks) and the authorities, which are setting transparent, low inflation rate policies. The two continue to feed each other. Nothing short of a confidence can shake this fearful yet stable equilibrium. Waiting for that crisis, unfortunately is unprofitable and, given the cheapness of protection against the tail risks, not the course of action you should expect most profit-driven speculators to follow.”

For now, the general consensus is for the yen to stay weak as UBS, AG and RBC Capital Markets both reduced their estimates for the yen. There is, however, a dissenting voice from none other than our irreverent and insightful Marc Faber of the famed, Doom, Gloom and Boom report. In the recent Barron’s Round Table he shared a different take on it. Marc is betting on volatility this year and would play it this way:

“Consider the carry trade – investors buying in yen and investing in higher-yielding assets around the world. They’re not buying dividend-paying assets, but assets like the Indian stock market. The yen carry trade will unwind when, suddenly, these risky assets begin to perform badly relative to cash rates in Japan or the Japanese stock market. Then leverage will be reduced and people will reinvest in yen. When the reversal occurs, the yen will soar against, say, the dollar. My macro pick for 2007 is to buy the yen long or long-dated calls on yen. In the long run, it is a bad policy to borrow in a low-yielding currency and invest in a high-yielding currency. It works for one year, two years, three years, and suddenly it massively doesn’t work.”

As traders we have to understand both sides of the argument and, in addition, we must look at the charts, the Commitment of Traders report and consider the seasonal tendencies. Last week the yen took out the previous week’s high and low and closed higher for the week. In making that low the yen went below the lows going back to December of 2005, but quickly rejected it. I would consider this a critical area as we made a low last week of 82.38, taking out the 2005 low of 82.52. Back in 2003, we had a double bottom at 82.20 and then rallied sharply to 97.00 into 2004. So, this 82.20 - 82.50 area is critical support and taking it out could see prices break quickly to the 80.00 level.

The Commitment of Traders report (COT) reveals a market that is not overly short. On the CME the net short yen positions still represent only 38 per cent of all yen contracts. I would want to see the COT with a larger share of short positions to begin thinking about fading the short side. Also, the seasonal tendency for the yen is to sell off during this time of year. Over the last 10 years, the yen has consistently lost anywhere from 2.15% to 3.17% between February 3rd through April 12th. If we follow the seasonal pattern this year we could see the yen trade down and test the 80.00 level. Perhaps, then we could find some attractive long-dated calls on the yen.

We have to keep in mind that anything can happen and realize too that the Japanese investor’s appetite for overseas assets continues to be insatiable which adds to the yens weakness. Despite big outflows, 93 per cent of Japanese household wealth is still yen-denominated. All of this plays a role in the value of the yen, but as we all know trends do not continue forever and things can change rather quickly. Like Hank Paulsen, I will be watching this very, very closely both for direction and volatility - for volatility is the enemy of all carry strategies.

Sunday, February 4, 2007

Crude Oil

Crude OilSocialTwist Tell-a-Friend
Sally Limantour
January 28, 2007

The energy markets had fresh news on all fronts with weekly prices closing higher for the first time since mid December. If you are trading energy you have to keep tabs on the weather, OPEC, MEND (Nigeria), Iraq, Iran, Venezuela, Mexico, stocks/usage and alternative energy news. It is a full time job!

President Bush’s State of the Union address last week called for, “twenty in ten” where he proposed cutting US gasoline demand by 20% in 10 years with plans to switch to alternative fuels by 15% and another 5% to be saved by increasing fuel-economy standards. He also announced a goal of using 35 billion gallons per year of alternative fuel by 2017. This is 7 times the current level and about 5 times the current Renewable Fuel Standard of 7.5 billion gallons by 2012. This is an extremely ambitious goal as there just isn’t enough US farmland in the US to produce that much corn.

The January reports from the US DOE/EIA and the monthly OPEC report showed demand growth forecasts were basically unchanged. There were, however, downward revisions in the non-OPEC supply forecast by the IEA which were cut by 300k/b in 2007. Talk of China building strategic oil reserves was an added bullish demand factor and it is now estimated that the US and China will account for over half of the world’s consumption growth in 2007.

This coupled with the colder weather patterns and violence in Nigeria all helped to prop up prices of crude oil after it briefly broke the $50.00 level. The sell off in crude oil from the highs of last August has occurred in two waves. The first wave occurred between August and late September as the market was working off the potential hurricane premium and it was exhibiting lower geopolitical premium. The second sell off happened during December through January and this was due to the warm weather and the rebalancing of the commodity index in January. What is next for crude oil? It seems that with speculation of a US military strike against Iran or a potential oil embargo in the air that perhaps crude oil has seen its low for now. The push to fill the Strategic Petroleum Reserve with initial purchases of 11 million barrels is also supportive. I am currently watching the crude oil from the long side. If we can hold above 52.50 and build support above $54 for a while the market could attempt a mildly bullish stance. Perhaps, at least this would silence those calling for $30 oil.

There is an interesting relationship with the CRB and energy. The crude oil sell off from the highs in August has caused the CRB to break important support levels. As a result many have claimed the commodity bull market is over. A closer look however shows that there has been a radical revision in the CRB index since July 2006 which has skewed the overall makeup of the index. This 10th revision now has oil making up 33% of the index and this has huge implications for those watching the CRB. I urge everyone to read the excellent piece by Adam Hamilton at (www.zealllc.com) titled, CRB Dominated by Oil, for a complete understanding of this change.

Disclaimer and Terms of Service

© Copyright 1998-2023, Hamzei Analytics, LLC. Hamzei Financial Network is published by Hamzei Analytics, LLC, Naples, FL 34112, Admin@HamzeiAnalytics.com (310) 306-1200. The information herein was obtained from sources which Hamzei Analytics, LLC believes are reliable, but we can not and do not guarantee its accuracy. None of the information, advertisements, website links, or any opinions expressed constitutes a solicitation of the purchase or sale of any securities or commodities. Please note that Hamzei Analytics, LLC or its principals may already have invested or may from time to time invest in securities or commodities that are recommended or otherwise covered on this website. Neither Hamzei Analytics, LLC nor its principals intend to disclose the extent of any current holdings or future transactions with respect to any particular security or commodity. You should consider this possibility before investing in any security or commodity based upon statements and information contained in any report, post, comment or recommendation you receive from us. The content on this site is provided as general information only and should not be taken as investment or trading advice. Any action that you take as a result of information, analysis, or conclusion on this site is ultimately your responsibility. Always consult your financial adviser(s) before making any investment or trading decisions.